This is “Basic Concepts of Probability”, chapter 3 from the book Beginning Statistics (v. 1.0). For details on it (including licensing), click here.
For more information on the source of this book, or why it is available for free, please see the project's home page. You can browse or download additional books there.


Chapter 3 Basic Concepts of Probability
Suppose a polling organization questions 1,200 voters in order to estimate the proportion of all voters who favor a particular bond issue. We would expect the proportion of the 1,200 voters in the survey who are in favor to be close to the proportion of all voters who are in favor, but this need not be true. There is a degree of randomness associated with the survey result. If the survey result is highly likely to be close to the true proportion, then we have confidence in the survey result. If it is not particularly likely to be close to the population proportion, then we would perhaps not take the survey result too seriously. The likelihood that the survey proportion is close to the population proportion determines our confidence in the survey result. For that reason, we would like to be able to compute that likelihood. The task of computing it belongs to the realm of probability, which we study in this chapter.
3.1 Sample Spaces, Events, and Their Probabilities
Learning Objectives
- To learn the concept of the sample space associated with a random experiment.
- To learn the concept of an event associated with a random experiment.
- To learn the concept of the probability of an event.
Sample Spaces and Events
Rolling an ordinary six-sided die is a familiar example of a random experiment, an action for which all possible outcomes can be listed, but for which the actual outcome on any given trial of the experiment cannot be predicted with certainty. In such a situation we wish to assign to each outcome, such as rolling a two, a number, called the probability of the outcome, that indicates how likely it is that the outcome will occur. Similarly, we would like to assign a probability to any event, or collection of outcomes, such as rolling an even number, which indicates how likely it is that the event will occur if the experiment is performed. This section provides a framework for discussing probability problems, using the terms just mentioned.
Definition
A random experiment is a mechanism that produces a definite outcome that cannot be predicted with certainty. The sample spaceThe set of all possible outcomes of a random experiment. associated with a random experiment is the set of all possible outcomes. An eventAny set of outcomes. is a subset of the sample space.
Definition
An event E is said to occur on a particular trial of the experiment if the outcome observed is an element of the set E.
Example 1
Construct a sample space for the experiment that consists of tossing a single coin.
Solution:
The outcomes could be labeled h for heads and t for tails. Then the sample space is the set
Example 2
Construct a sample space for the experiment that consists of rolling a single die. Find the events that correspond to the phrases “an even number is rolled” and “a number greater than two is rolled.”
Solution:
The outcomes could be labeled according to the number of dots on the top face of the die. Then the sample space is the set
The outcomes that are even are 2, 4, and 6, so the event that corresponds to the phrase “an even number is rolled” is the set {2,4,6}, which it is natural to denote by the letter E. We write
Similarly the event that corresponds to the phrase “a number greater than two is rolled” is the set , which we have denoted T.
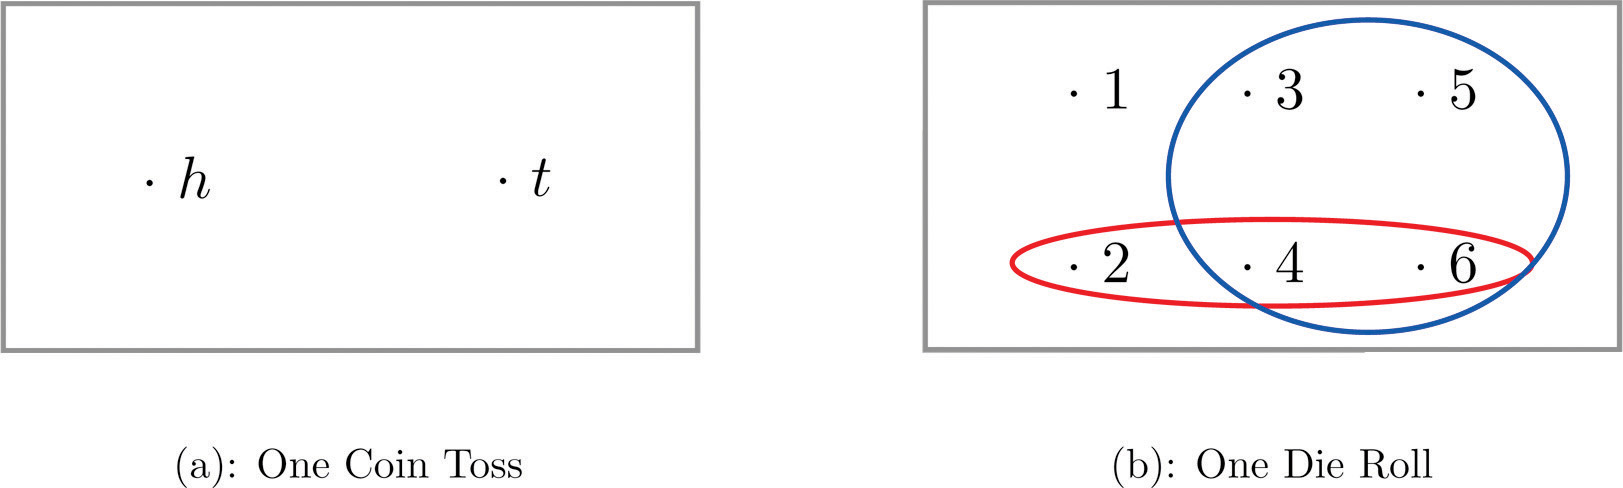
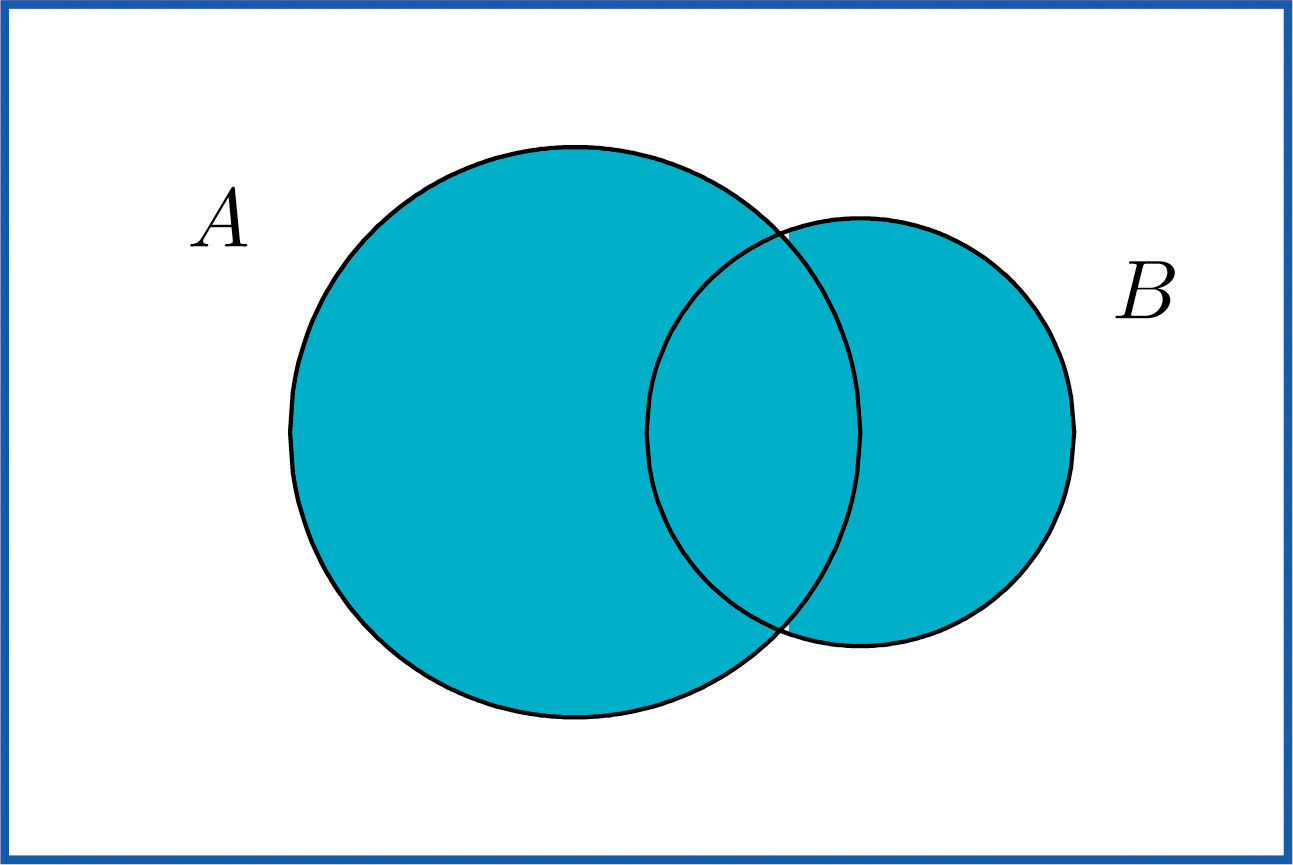
A graphical representation of a sample space and events is a Venn diagram, as shown in Figure 3.1 "Venn Diagrams for Two Sample Spaces" for Note 3.6 "Example 1" and Note 3.7 "Example 2". In general the sample space S is represented by a rectangle, outcomes by points within the rectangle, and events by ovals that enclose the outcomes that compose them.
Figure 3.1 Venn Diagrams for Two Sample Spaces
Example 3
A random experiment consists of tossing two coins.
- Construct a sample space for the situation that the coins are indistinguishable, such as two brand new pennies.
- Construct a sample space for the situation that the coins are distinguishable, such as one a penny and the other a nickel.
Solution:
- After the coins are tossed one sees either two heads, which could be labeled , two tails, which could be labeled , or coins that differ, which could be labeled d. Thus a sample space is
- Since we can tell the coins apart, there are now two ways for the coins to differ: the penny heads and the nickel tails, or the penny tails and the nickel heads. We can label each outcome as a pair of letters, the first of which indicates how the penny landed and the second of which indicates how the nickel landed. A sample space is then
A device that can be helpful in identifying all possible outcomes of a random experiment, particularly one that can be viewed as proceeding in stages, is what is called a tree diagram. It is described in the following example.
Example 4
Construct a sample space that describes all three-child families according to the genders of the children with respect to birth order.
Solution:
Two of the outcomes are “two boys then a girl,” which we might denote , and “a girl then two boys,” which we would denote Clearly there are many outcomes, and when we try to list all of them it could be difficult to be sure that we have found them all unless we proceed systematically. The tree diagram shown in Figure 3.2 "Tree Diagram For Three-Child Families", gives a systematic approach.
Figure 3.2 Tree Diagram For Three-Child Families
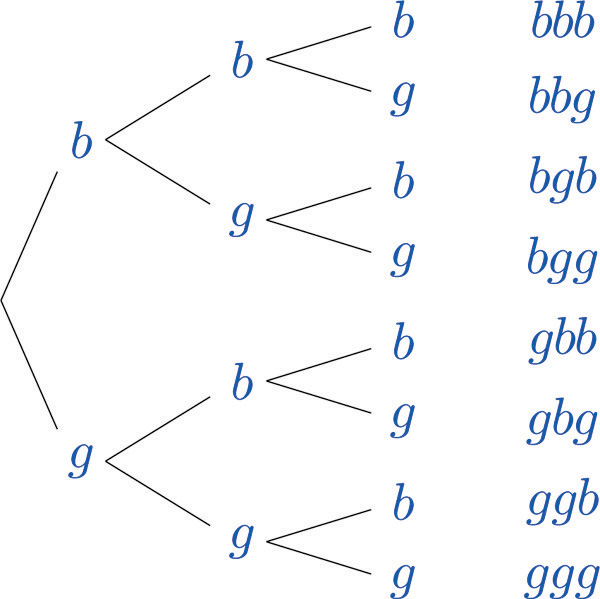
The diagram was constructed as follows. There are two possibilities for the first child, boy or girl, so we draw two line segments coming out of a starting point, one ending in a b for “boy” and the other ending in a g for “girl.” For each of these two possibilities for the first child there are two possibilities for the second child, “boy” or “girl,” so from each of the b and g we draw two line segments, one segment ending in a b and one in a g. For each of the four ending points now in the diagram there are two possibilities for the third child, so we repeat the process once more.
The line segments are called branches of the tree. The right ending point of each branch is called a node. The nodes on the extreme right are the final nodes; to each one there corresponds an outcome, as shown in the figure.
From the tree it is easy to read off the eight outcomes of the experiment, so the sample space is, reading from the top to the bottom of the final nodes in the tree,
Probability
Definition
The probability of an outcomeA number that measures the likelihood of the outcome. e in a sample space S is a number p between 0 and 1 that measures the likelihood that e will occur on a single trial of the corresponding random experiment. The value p = 0 corresponds to the outcome e being impossible and the value p = 1 corresponds to the outcome e being certain.
Definition
The probability of an eventA number that measures the likelihood of the event. A is the sum of the probabilities of the individual outcomes of which it is composed. It is denoted
The following formula expresses the content of the definition of the probability of an event:
If an event E is , then
Figure 3.3 "Sample Spaces and Probability" graphically illustrates the definitions.
Figure 3.3 Sample Spaces and Probability
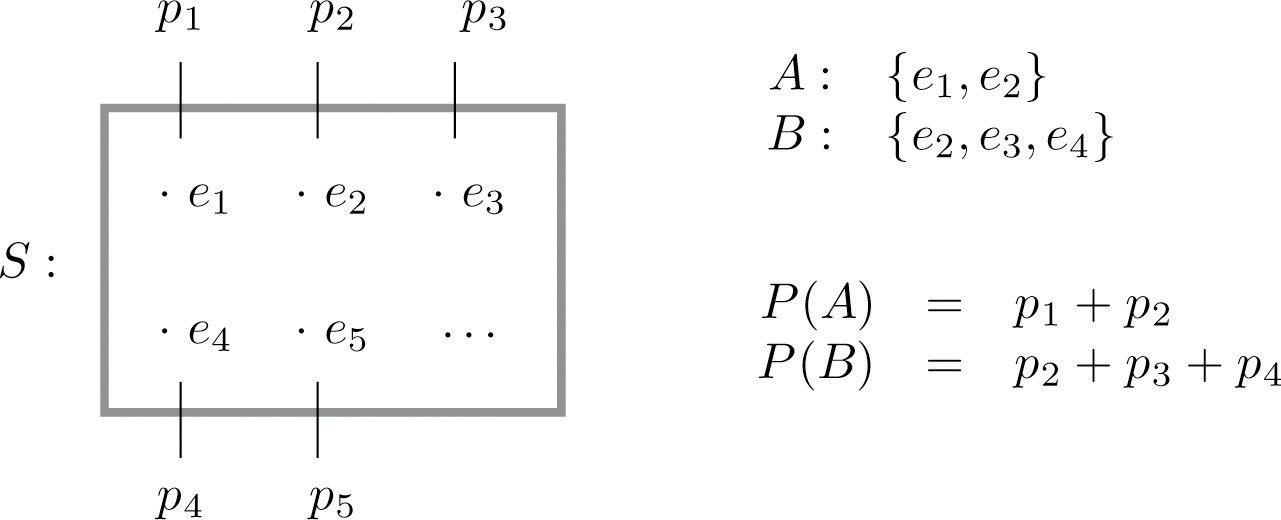
Since the whole sample space S is an event that is certain to occur, the sum of the probabilities of all the outcomes must be the number 1.
In ordinary language probabilities are frequently expressed as percentages. For example, we would say that there is a 70% chance of rain tomorrow, meaning that the probability of rain is 0.70. We will use this practice here, but in all the computational formulas that follow we will use the form 0.70 and not 70%.
Example 5
A coin is called “balanced” or “fair” if each side is equally likely to land up. Assign a probability to each outcome in the sample space for the experiment that consists of tossing a single fair coin.
Solution:
With the outcomes labeled h for heads and t for tails, the sample space is the set Since the outcomes have the same probabilities, which must add up to 1, each outcome is assigned probability 1/2.
Example 6
A die is called “balanced” or “fair” if each side is equally likely to land on top. Assign a probability to each outcome in the sample space for the experiment that consists of tossing a single fair die. Find the probabilities of the events E: “an even number is rolled” and T: “a number greater than two is rolled.”
Solution:
With outcomes labeled according to the number of dots on the top face of the die, the sample space is the set Since there are six equally likely outcomes, which must add up to 1, each is assigned probability 1/6.
Since ,
Since ,
Example 7
Two fair coins are tossed. Find the probability that the coins match, i.e., either both land heads or both land tails.
Solution:
In Note 3.8 "Example 3" we constructed the sample space for the situation in which the coins are identical and the sample space for the situation in which the two coins can be told apart.
The theory of probability does not tell us how to assign probabilities to the outcomes, only what to do with them once they are assigned. Specifically, using sample space S, matching coins is the event , which has probability Using sample space , matching coins is the event , which has probability In the physical world it should make no difference whether the coins are identical or not, and so we would like to assign probabilities to the outcomes so that the numbers and are the same and best match what we observe when actual physical experiments are performed with coins that seem to be fair. Actual experience suggests that the outcomes in are equally likely, so we assign to each probability 1∕4, and then
Similarly, from experience appropriate choices for the outcomes in S are:
which give the same final answer
The previous three examples illustrate how probabilities can be computed simply by counting when the sample space consists of a finite number of equally likely outcomes. In some situations the individual outcomes of any sample space that represents the experiment are unavoidably unequally likely, in which case probabilities cannot be computed merely by counting, but the computational formula given in the definition of the probability of an event must be used.
Example 8
The breakdown of the student body in a local high school according to race and ethnicity is 51% white, 27% black, 11% Hispanic, 6% Asian, and 5% for all others. A student is randomly selected from this high school. (To select “randomly” means that every student has the same chance of being selected.) Find the probabilities of the following events:
- B: the student is black,
- M: the student is minority (that is, not white),
- N: the student is not black.
Solution:
The experiment is the action of randomly selecting a student from the student population of the high school. An obvious sample space is Since 51% of the students are white and all students have the same chance of being selected, , and similarly for the other outcomes. This information is summarized in the following table:
- Since ,
- Since ,
- Since ,
Example 9
The student body in the high school considered in Note 3.18 "Example 8" may be broken down into ten categories as follows: 25% white male, 26% white female, 12% black male, 15% black female, 6% Hispanic male, 5% Hispanic female, 3% Asian male, 3% Asian female, 1% male of other minorities combined, and 4% female of other minorities combined. A student is randomly selected from this high school. Find the probabilities of the following events:
- B: the student is black,
- : the student is minority female,
- : the student is female and is not black.
Solution:
Now the sample space is The information given in the example can be summarized in the following table, called a two-way contingency table:
| Gender | Race / Ethnicity | ||||
|---|---|---|---|---|---|
| White | Black | Hispanic | Asian | Others | |
| Male | 0.25 | 0.12 | 0.06 | 0.03 | 0.01 |
| Female | 0.26 | 0.15 | 0.05 | 0.03 | 0.04 |
- Since ,
- Since ,
- Since ,
Key Takeaways
- The sample space of a random experiment is the collection of all possible outcomes.
- An event associated with a random experiment is a subset of the sample space.
- The probability of any outcome is a number between 0 and 1. The probabilities of all the outcomes add up to 1.
- The probability of any event A is the sum of the probabilities of the outcomes in A.
Exercises
-
A box contains 10 white and 10 black marbles. Construct a sample space for the experiment of randomly drawing out, with replacement, two marbles in succession and noting the color each time. (To draw “with replacement” means that the first marble is put back before the second marble is drawn.)
-
A box contains 16 white and 16 black marbles. Construct a sample space for the experiment of randomly drawing out, with replacement, three marbles in succession and noting the color each time. (To draw “with replacement” means that each marble is put back before the next marble is drawn.)
-
A box contains 8 red, 8 yellow, and 8 green marbles. Construct a sample space for the experiment of randomly drawing out, with replacement, two marbles in succession and noting the color each time.
-
A box contains 6 red, 6 yellow, and 6 green marbles. Construct a sample space for the experiment of randomly drawing out, with replacement, three marbles in succession and noting the color each time.
-
In the situation of Exercise 1, list the outcomes that comprise each of the following events.
- At least one marble of each color is drawn.
- No white marble is drawn.
-
In the situation of Exercise 2, list the outcomes that comprise each of the following events.
- At least one marble of each color is drawn.
- No white marble is drawn.
- More black than white marbles are drawn.
-
In the situation of Exercise 3, list the outcomes that comprise each of the following events.
- No yellow marble is drawn.
- The two marbles drawn have the same color.
- At least one marble of each color is drawn.
-
In the situation of Exercise 4, list the outcomes that comprise each of the following events.
- No yellow marble is drawn.
- The three marbles drawn have the same color.
- At least one marble of each color is drawn.
-
Assuming that each outcome is equally likely, find the probability of each event in Exercise 5.
-
Assuming that each outcome is equally likely, find the probability of each event in Exercise 6.
-
Assuming that each outcome is equally likely, find the probability of each event in Exercise 7.
-
Assuming that each outcome is equally likely, find the probability of each event in Exercise 8.
-
A sample space is Identify two events as and Suppose and are each 0.2 and and are each 0.1.
- Determine what must be.
- Find
- Find
-
A sample space is Identify two events as and Suppose , , and
- Determine what must be.
- Find
- Find
-
A sample space is Identify two events as and The probabilities of some of the outcomes are given by the following table:
- Determine what must be.
- Find
- Find
-
A sample space is Identify two events as and The probabilities of some of the outcomes are given by the following table:
- Determine what must be.
- Find
- Find
Basic
-
The sample space that describes all three-child families according to the genders of the children with respect to birth order was constructed in Note 3.9 "Example 4". Identify the outcomes that comprise each of the following events in the experiment of selecting a three-child family at random.
- At least one child is a girl.
- At most one child is a girl.
- All of the children are girls.
- Exactly two of the children are girls.
- The first born is a girl.
-
The sample space that describes three tosses of a coin is the same as the one constructed in Note 3.9 "Example 4" with “boy” replaced by “heads” and “girl” replaced by “tails.” Identify the outcomes that comprise each of the following events in the experiment of tossing a coin three times.
- The coin lands heads more often than tails.
- The coin lands heads the same number of times as it lands tails.
- The coin lands heads at least twice.
- The coin lands heads on the last toss.
-
Assuming that the outcomes are equally likely, find the probability of each event in Exercise 17.
-
Assuming that the outcomes are equally likely, find the probability of each event in Exercise 18.
Applications
-
The following two-way contingency table gives the breakdown of the population in a particular locale according to age and tobacco usage:
Age Tobacco Use Smoker Non-smoker Under 30 0.05 0.20 Over 30 0.20 0.55 A person is selected at random. Find the probability of each of the following events.
- The person is a smoker.
- The person is under 30.
- The person is a smoker who is under 30.
-
The following two-way contingency table gives the breakdown of the population in a particular locale according to party affiliation (A, B, C, or None) and opinion on a bond issue:
Affiliation Opinion Favors Opposes Undecided A 0.12 0.09 0.07 B 0.16 0.12 0.14 C 0.04 0.03 0.06 None 0.08 0.06 0.03 A person is selected at random. Find the probability of each of the following events.
- The person is affiliated with party B.
- The person is affiliated with some party.
- The person is in favor of the bond issue.
- The person has no party affiliation and is undecided about the bond issue.
-
The following two-way contingency table gives the breakdown of the population of married or previously married women beyond child-bearing age in a particular locale according to age at first marriage and number of children:
Age Number of Children 0 1 or 2 3 or More Under 20 0.02 0.14 0.08 20–29 0.07 0.37 0.11 30 and above 0.10 0.10 0.01 A woman is selected at random. Find the probability of each of the following events.
- The woman was in her twenties at her first marriage.
- The woman was 20 or older at her first marriage.
- The woman had no children.
- The woman was in her twenties at her first marriage and had at least three children.
-
The following two-way contingency table gives the breakdown of the population of adults in a particular locale according to highest level of education and whether or not the individual regularly takes dietary supplements:
Education Use of Supplements Takes Does Not Take No High School Diploma 0.04 0.06 High School Diploma 0.06 0.44 Undergraduate Degree 0.09 0.28 Graduate Degree 0.01 0.02 An adult is selected at random. Find the probability of each of the following events.
- The person has a high school diploma and takes dietary supplements regularly.
- The person has an undergraduate degree and takes dietary supplements regularly.
- The person takes dietary supplements regularly.
- The person does not take dietary supplements regularly.
Additional Exercises
-
Large Data Sets 4 and 4A record the results of 500 tosses of a coin. Find the relative frequency of each outcome 1, 2, 3, 4, 5, and 6. Does the coin appear to be “balanced” or “fair”?
http://www.flatworldknowledge.com/sites/all/files/data4.xls
http://www.flatworldknowledge.com/sites/all/files/data4A.xls
-
Large Data Sets 6, 6A, and 6B record results of a random survey of 200 voters in each of two regions, in which they were asked to express whether they prefer Candidate A for a U.S. Senate seat or prefer some other candidate.
- Find the probability that a randomly selected voter among these 400 prefers Candidate A.
- Find the probability that a randomly selected voter among the 200 who live in Region 1 prefers Candidate A (separately recorded in Large Data Set 6A).
- Find the probability that a randomly selected voter among the 200 who live in Region 2 prefers Candidate A (separately recorded in Large Data Set 6B).
http://www.flatworldknowledge.com/sites/all/files/data6.xls
http://www.flatworldknowledge.com/sites/all/files/data6A.xls
http://www.flatworldknowledge.com/sites/all/files/data6B.xls
Large Data Set Exercises
Answers
-
-
-
-
-
-
-
- ∅
-
-
- 2/4
- 1/4
-
-
- 4/9
- 3/9
- 0
-
-
- 0.4
- 0.5
- 0.4
-
-
- 0.21
- 0.6
- 0.61
-
-
-
-
- 7/8
- 4/8
- 1/8
- 3/8
- 4/8
-
-
- 0.25
- 0.25
- 0.05
-
-
- 0.55
- 0.76
- 0.19
- 0.11
-
-
The relative frequencies for 1 through 6 are 0.16, 0.194, 0.162, 0.164, 0.154 and 0.166. It would appear that the die is not balanced.
-
3.2 Complements, Intersections, and Unions
Learning Objectives
- To learn how some events are naturally expressible in terms of other events.
- To learn how to use special formulas for the probability of an event that is expressed in terms of one or more other events.
Some events can be naturally expressed in terms of other, sometimes simpler, events.
Complements
Definition
The complement of an eventThe event does not occur. A in a sample space S, denoted Ac, is the collection of all outcomes in S that are not elements of the set A. It corresponds to negating any description in words of the event A.
Example 10
Two events connected with the experiment of rolling a single die are E: “the number rolled is even” and T: “the number rolled is greater than two.” Find the complement of each.
Solution:
In the sample space the corresponding sets of outcomes are and The complements are and
In words the complements are described by “the number rolled is not even” and “the number rolled is not greater than two.” Of course easier descriptions would be “the number rolled is odd” and “the number rolled is less than three.”
If there is a 60% chance of rain tomorrow, what is the probability of fair weather? The obvious answer, 40%, is an instance of the following general rule.
Probability Rule for Complements
This formula is particularly useful when finding the probability of an event directly is difficult.
Example 11
Find the probability that at least one heads will appear in five tosses of a fair coin.
Solution:
Identify outcomes by lists of five hs and ts, such as and Although it is tedious to list them all, it is not difficult to count them. Think of using a tree diagram to do so. There are two choices for the first toss. For each of these there are two choices for the second toss, hence outcomes for two tosses. For each of these four outcomes, there are two possibilities for the third toss, hence outcomes for three tosses. Similarly, there are outcomes for four tosses and finally outcomes for five tosses.
Let O denote the event “at least one heads.” There are many ways to obtain at least one heads, but only one way to fail to do so: all tails. Thus although it is difficult to list all the outcomes that form O, it is easy to write Since there are 32 equally likely outcomes, each has probability 1/32, so , hence or about a 97% chance.
Intersection of Events
Definition
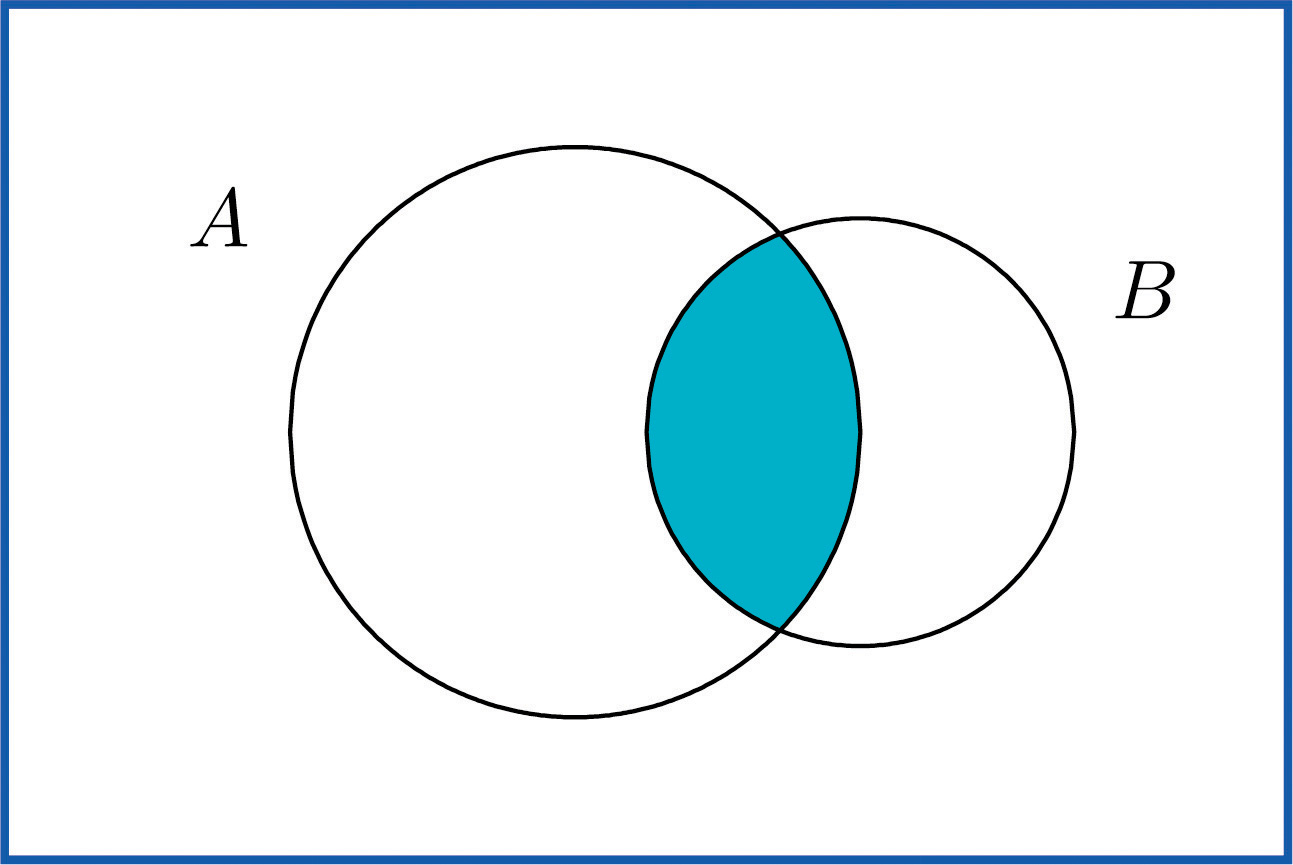
The intersection of eventsBoth events occur. A and B, denoted A ∩ B, is the collection of all outcomes that are elements of both of the sets A and B. It corresponds to combining descriptions of the two events using the word “and.”
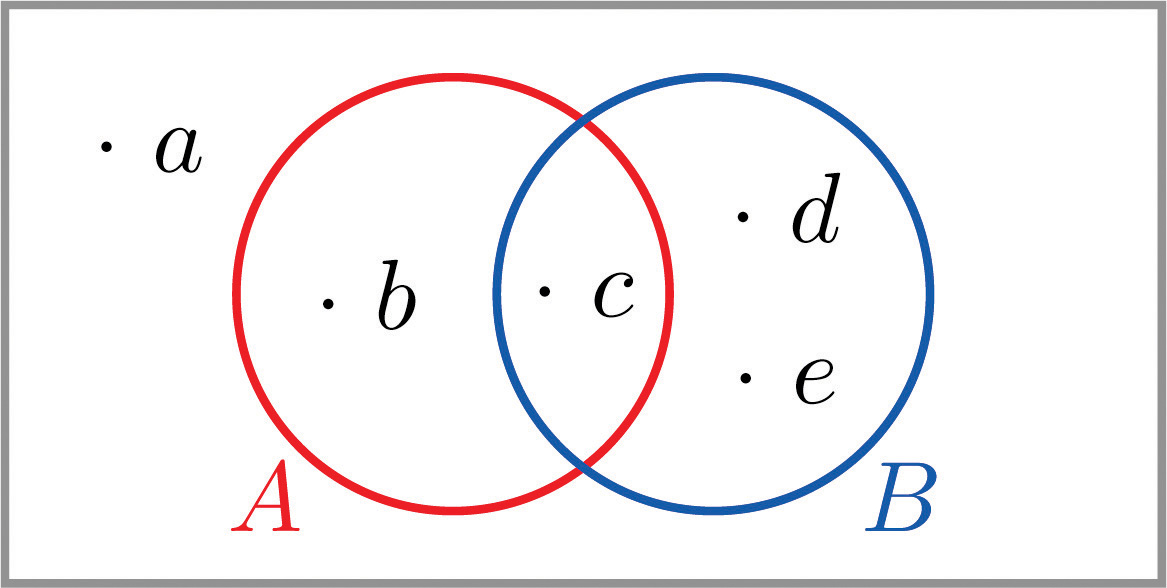
To say that the event A ∩ B occurred means that on a particular trial of the experiment both A and B occurred. A visual representation of the intersection of events A and B in a sample space S is given in Figure 3.4 "The Intersection of Events ". The intersection corresponds to the shaded lens-shaped region that lies within both ovals.
Figure 3.4 The Intersection of Events A and B
Example 12
In the experiment of rolling a single die, find the intersection E ∩ T of the events E: “the number rolled is even” and T: “the number rolled is greater than two.”
Solution:
The sample space is Since the outcomes that are common to and are 4 and 6,
In words the intersection is described by “the number rolled is even and is greater than two.” The only numbers between one and six that are both even and greater than two are four and six, corresponding to E ∩ T given above.
Example 13
A single die is rolled.
- Suppose the die is fair. Find the probability that the number rolled is both even and greater than two.
- Suppose the die has been “loaded” so that , , and the remaining four outcomes are equally likely with one another. Now find the probability that the number rolled is both even and greater than two.
Solution:
In both cases the sample space is and the event in question is the intersection of the previous example.
- Since the die is fair, all outcomes are equally likely, so by counting we have
-
The information on the probabilities of the six outcomes that we have so far is
Since and the probabilities of all six outcomes add up to 1,
Thus , so In particular Therefore
Definition
Events A and B are mutually exclusiveEvents that cannot both occur at once. if they have no elements in common.
For A and B to have no outcomes in common means precisely that it is impossible for both A and B to occur on a single trial of the random experiment. This gives the following rule.
Probability Rule for Mutually Exclusive Events
Events A and B are mutually exclusive if and only if
Any event A and its complement Ac are mutually exclusive, but A and B can be mutually exclusive without being complements.
Example 14
In the experiment of rolling a single die, find three choices for an event A so that the events A and E: “the number rolled is even” are mutually exclusive.
Solution:
Since and we want A to have no elements in common with E, any event that does not contain any even number will do. Three choices are {1,3,5} (the complement Ec, the odds), {1,3}, and {5}.
Union of Events
Definition
The union of eventsOne or the other event occurs. A and B, denoted A ∪ B, is the collection of all outcomes that are elements of one or the other of the sets A and B, or of both of them. It corresponds to combining descriptions of the two events using the word “or.”
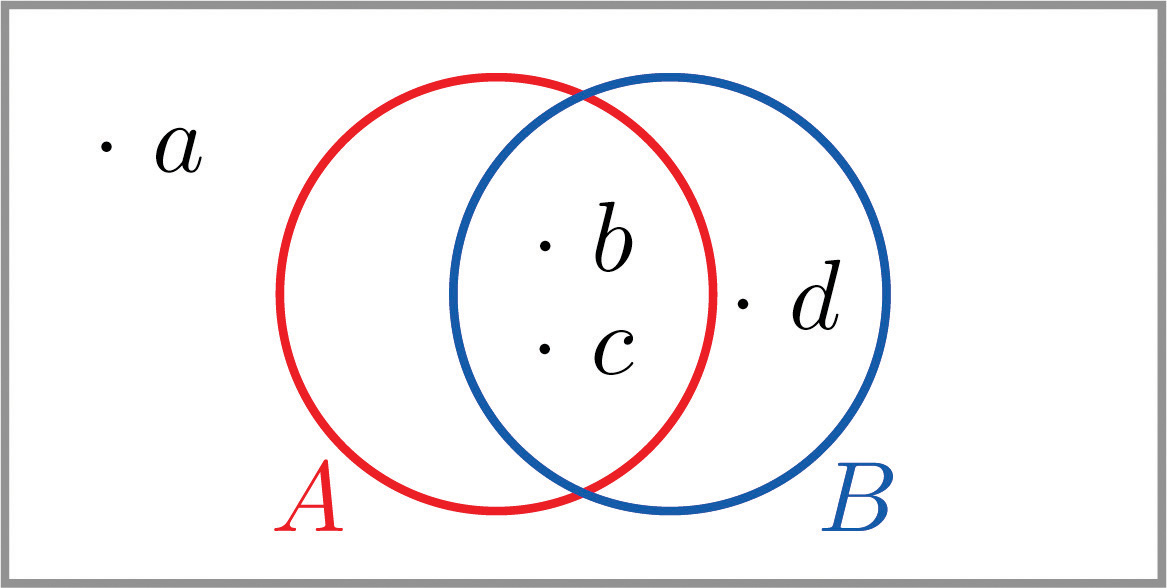
To say that the event A ∪ B occurred means that on a particular trial of the experiment either A or B occurred (or both did). A visual representation of the union of events A and B in a sample space S is given in Figure 3.5 "The Union of Events ". The union corresponds to the shaded region.
Figure 3.5 The Union of Events A and B
Example 15
In the experiment of rolling a single die, find the union of the events E: “the number rolled is even” and T: “the number rolled is greater than two.”
Solution:
Since the outcomes that are in either or (or both) are 2, 3, 4, 5, and 6, Note that an outcome such as 4 that is in both sets is still listed only once (although strictly speaking it is not incorrect to list it twice).
In words the union is described by “the number rolled is even or is greater than two.” Every number between one and six except the number one is either even or is greater than two, corresponding to E ∪ T given above.
Example 16
A two-child family is selected at random. Let B denote the event that at least one child is a boy, let D denote the event that the genders of the two children differ, and let M denote the event that the genders of the two children match. Find B ∪ D and
Solution:
A sample space for this experiment is , where the first letter denotes the gender of the firstborn child and the second letter denotes the gender of the second child. The events B, D, and M are
Each outcome in D is already in B, so the outcomes that are in at least one or the other of the sets B and D is just the set B itself:
Every outcome in the whole sample space S is in at least one or the other of the sets B and M, so
The following Additive Rule of Probability is a useful formula for calculating the probability of
Additive Rule of Probability
The next example, in which we compute the probability of a union both by counting and by using the formula, shows why the last term in the formula is needed.
Example 17
Two fair dice are thrown. Find the probabilities of the following events:
- both dice show a four
- at least one die shows a four
Solution:
As was the case with tossing two identical coins, actual experience dictates that for the sample space to have equally likely outcomes we should list outcomes as if we could distinguish the two dice. We could imagine that one of them is red and the other is green. Then any outcome can be labeled as a pair of numbers as in the following display, where the first number in the pair is the number of dots on the top face of the green die and the second number in the pair is the number of dots on the top face of the red die.
- There are 36 equally likely outcomes, of which exactly one corresponds to two fours, so the probability of a pair of fours is 1/36.
-
From the table we can see that there are 11 pairs that correspond to the event in question: the six pairs in the fourth row (the green die shows a four) plus the additional five pairs other than the pair 44, already counted, in the fourth column (the red die is four), so the answer is 11/36. To see how the formula gives the same number, let AG denote the event that the green die is a four and let AR denote the event that the red die is a four. Then clearly by counting we get and Since , ; this is the computation in part (a), of course. Thus by the Additive Rule of Probability,
Example 18
A tutoring service specializes in preparing adults for high school equivalence tests. Among all the students seeking help from the service, 63% need help in mathematics, 34% need help in English, and 27% need help in both mathematics and English. What is the percentage of students who need help in either mathematics or English?
Solution:
Imagine selecting a student at random, that is, in such a way that every student has the same chance of being selected. Let M denote the event “the student needs help in mathematics” and let E denote the event “the student needs help in English.” The information given is that , , and The Additive Rule of Probability gives
Note how the naïve reasoning that if 63% need help in mathematics and 34% need help in English then 63 plus 34 or 97% need help in one or the other gives a number that is too large. The percentage that need help in both subjects must be subtracted off, else the people needing help in both are counted twice, once for needing help in mathematics and once again for needing help in English. The simple sum of the probabilities would work if the events in question were mutually exclusive, for then is zero, and makes no difference.
Example 19
Volunteers for a disaster relief effort were classified according to both specialty (C: construction, E: education, M: medicine) and language ability (S: speaks a single language fluently, T: speaks two or more languages fluently). The results are shown in the following two-way classification table:
| Specialty | Language Ability | |
|---|---|---|
| S | T | |
| C | 12 | 1 |
| E | 4 | 3 |
| M | 6 | 2 |
The first row of numbers means that 12 volunteers whose specialty is construction speak a single language fluently, and 1 volunteer whose specialty is construction speaks at least two languages fluently. Similarly for the other two rows.
A volunteer is selected at random, meaning that each one has an equal chance of being chosen. Find the probability that:
- his specialty is medicine and he speaks two or more languages;
- either his specialty is medicine or he speaks two or more languages;
- his specialty is something other than medicine.
Solution:
When information is presented in a two-way classification table it is typically convenient to adjoin to the table the row and column totals, to produce a new table like this:
| Specialty | Language Ability | Total | |
|---|---|---|---|
| S | T | ||
| C | 12 | 1 | 13 |
| E | 4 | 3 | 7 |
| M | 6 | 2 | 8 |
| Total | 22 | 6 | 28 |
- The probability sought is The table shows that there are 2 such people, out of 28 in all, hence or about a 7% chance.
-
The probability sought is The third row total and the grand total in the sample give The second column total and the grand total give Thus using the result from part (a),
or about a 43% chance.
-
This probability can be computed in two ways. Since the event of interest can be viewed as the event C ∪ E and the events C and E are mutually exclusive, the answer is, using the first two row totals,
On the other hand, the event of interest can be thought of as the complement Mc of M, hence using the value of computed in part (b),
as before.
Key Takeaway
- The probability of an event that is a complement or union of events of known probability can be computed using formulas.
Exercises
-
For the sample space identify the complement of each event given.
- S
-
For the sample space identify the complement of each event given.
- ∅ (the “empty” set that has no elements)
-
The sample space for three tosses of a coin is
Define events
- List the outcomes that comprise H and M.
- List the outcomes that comprise H ∩ M, H ∪ M, and Hc.
- Assuming all outcomes are equally likely, find , , and
- Determine whether or not Hc and M are mutually exclusive. Explain why or why not.
-
For the experiment of rolling a single six-sided die once, define events
- List the outcomes that comprise T and G.
- List the outcomes that comprise T ∩ G, T ∪ G, Tc, and
- Assuming all outcomes are equally likely, find , , and
- Determine whether or not T and G are mutually exclusive. Explain why or why not.
-
A special deck of 16 cards has 4 that are blue, 4 yellow, 4 green, and 4 red. The four cards of each color are numbered from one to four. A single card is drawn at random. Define events
- List the outcomes that comprise B, R, and N.
- List the outcomes that comprise B ∩ R, B ∪ R, B ∩ N, R ∪ N, Bc, and
- Assuming all outcomes are equally likely, find the probabilities of the events in the previous part.
- Determine whether or not B and N are mutually exclusive. Explain why or why not.
-
In the context of the previous problem, define events
- List the outcomes that comprise Y, I, and J.
- List the outcomes that comprise Y ∩ I, Y ∪ J, I ∩ J, Ic, and
- Assuming all outcomes are equally likely, find the probabilities of the events in the previous part.
- Determine whether or not Ic and J are mutually exclusive. Explain why or why not.
-
The Venn diagram provided shows a sample space and two events A and B. Suppose , , , , and Confirm that the probabilities of the outcomes add up to 1, then compute the following probabilities.
- two ways: (i) by finding the outcomes in Ac and adding their probabilities, and (ii) using the Probability Rule for Complements.
- two ways: (i) by finding the outcomes in A ∪ B and adding their probabilities, and (ii) using the Additive Rule of Probability.
-
The Venn diagram provided shows a sample space and two events A and B. Suppose , , , and Confirm that the probabilities of the outcomes add up to 1, then compute the following probabilities.
- two ways: (i) by finding the outcomes in Ac and adding their probabilities, and (ii) using the Probability Rule for Complements.
- two ways: (i) by finding the outcomes in A ∪ B and adding their probabilities, and (ii) using the Additive Rule of Probability.
-
Confirm that the probabilities in the two-way contingency table add up to 1, then use it to find the probabilities of the events indicated.
U V W A 0.15 0.00 0.23 B 0.22 0.30 0.10 - , ,
- , ,
- Determine whether or not the events A and U are mutually exclusive; the events A and V.
-
Confirm that the probabilities in the two-way contingency table add up to 1, then use it to find the probabilities of the events indicated.
R S T M 0.09 0.25 0.19 N 0.31 0.16 0.00 - , ,
- , ,
- Determine whether or not the events N and S are mutually exclusive; the events N and T.
Basic
-
Make a statement in ordinary English that describes the complement of each event (do not simply insert the word “not”).
- In the roll of a die: “five or more.”
- In a roll of a die: “an even number.”
- In two tosses of a coin: “at least one heads.”
- In the random selection of a college student: “Not a freshman.”
-
Make a statement in ordinary English that describes the complement of each event (do not simply insert the word “not”).
- In the roll of a die: “two or less.”
- In the roll of a die: “one, three, or four.”
- In two tosses of a coin: “at most one heads.”
- In the random selection of a college student: “Neither a freshman nor a senior.”
-
The sample space that describes all three-child families according to the genders of the children with respect to birth order is
For each of the following events in the experiment of selecting a three-child family at random, state the complement of the event in the simplest possible terms, then find the outcomes that comprise the event and its complement.
- At least one child is a girl.
- At most one child is a girl.
- All of the children are girls.
- Exactly two of the children are girls.
- The first born is a girl.
-
The sample space that describes the two-way classification of citizens according to gender and opinion on a political issue is
where the first letter denotes gender (m: male, f: female) and the second opinion (f: for, a: against, n: neutral). For each of the following events in the experiment of selecting a citizen at random, state the complement of the event in the simplest possible terms, then find the outcomes that comprise the event and its complement.
- The person is male.
- The person is not in favor.
- The person is either male or in favor.
- The person is female and neutral.
-
A tourist who speaks English and German but no other language visits a region of Slovenia. If 35% of the residents speak English, 15% speak German, and 3% speak both English and German, what is the probability that the tourist will be able to talk with a randomly encountered resident of the region?
-
In a certain country 43% of all automobiles have airbags, 27% have anti-lock brakes, and 13% have both. What is the probability that a randomly selected vehicle will have both airbags and anti-lock brakes?
-
A manufacturer examines its records over the last year on a component part received from outside suppliers. The breakdown on source (supplier A, supplier B) and quality (H: high, U: usable, D: defective) is shown in the two-way contingency table.
H U D A 0.6937 0.0049 0.0014 B 0.2982 0.0009 0.0009 The record of a part is selected at random. Find the probability of each of the following events.
- The part was defective.
- The part was either of high quality or was at least usable, in two ways: (i) by adding numbers in the table, and (ii) using the answer to (a) and the Probability Rule for Complements.
- The part was defective and came from supplier B.
- The part was defective or came from supplier B, in two ways: by finding the cells in the table that correspond to this event and adding their probabilities, and (ii) using the Additive Rule of Probability.
-
Individuals with a particular medical condition were classified according to the presence (T) or absence (N) of a potential toxin in their blood and the onset of the condition (E: early, M: midrange, L: late). The breakdown according to this classification is shown in the two-way contingency table.
E M L T 0.012 0.124 0.013 N 0.170 0.638 0.043 One of these individuals is selected at random. Find the probability of each of the following events.
- The person experienced early onset of the condition.
- The onset of the condition was either midrange or late, in two ways: (i) by adding numbers in the table, and (ii) using the answer to (a) and the Probability Rule for Complements.
- The toxin is present in the person’s blood.
- The person experienced early onset of the condition and the toxin is present in the person’s blood.
- The person experienced early onset of the condition or the toxin is present in the person’s blood, in two ways: (i) by finding the cells in the table that correspond to this event and adding their probabilities, and (ii) using the Additive Rule of Probability.
-
The breakdown of the students enrolled in a university course by class (F: freshman, : sophomore, J: junior, : senior) and academic major (S: science, mathematics, or engineering, L: liberal arts, O: other) is shown in the two-way classification table.
Major Class F So J Se S 92 42 20 13 L 368 167 80 53 O 460 209 100 67 A student enrolled in the course is selected at random. Adjoin the row and column totals to the table and use the expanded table to find the probability of each of the following events.
- The student is a freshman.
- The student is a liberal arts major.
- The student is a freshman liberal arts major.
- The student is either a freshman or a liberal arts major.
- The student is not a liberal arts major.
-
The table relates the response to a fund-raising appeal by a college to its alumni to the number of years since graduation.
Response Years Since Graduation 0–5 6–20 21–35 Over 35 Positive 120 440 210 90 None 1380 3560 3290 910 An alumnus is selected at random. Adjoin the row and column totals to the table and use the expanded table to find the probability of each of the following events.
- The alumnus responded.
- The alumnus did not respond.
- The alumnus graduated at least 21 years ago.
- The alumnus graduated at least 21 years ago and responded.
Applications
-
The sample space for tossing three coins is
- List the outcomes that correspond to the statement “All the coins are heads.”
- List the outcomes that correspond to the statement “Not all the coins are heads.”
- List the outcomes that correspond to the statement “All the coins are not heads.”
Additional Exercises
Answers
-
- ∅
-
-
- ,
- , ,
- , ,
- Mutually exclusive because they have no elements in common.
-
-
- , ,
- , ,
- , , , , ,
- Not mutually exclusive because they have an element in common.
-
-
- 0.36
- 0.78
- 0.64
- 0.27
- 0.87
-
-
- , ,
- , ,
- 0.7
- 0.7
- A and U are not mutually exclusive because is the nonzero number 0.15. A and V are mutually exclusive because
-
-
- “four or less”
- “an odd number”
- “no heads” or “all tails”
- “a freshman”
-
-
-
“All the children are boys.”
Event: ,
Complement:
-
“At least two of the children are girls” or “There are two or three girls.”
Event: ,
Complement:
-
“At least one child is a boy.”
Event: ,
Complement:
-
“There are either no girls, exactly one girl, or three girls.”
Event: ,
Complement:
-
“The first born is a boy.”
Event: ,
Complement:
-
-
-
0.47
-
-
- 0.0023
- 0.9977
- 0.0009
- 0.3014
-
-
- 920/1671
- 668/1671
- 368/1671
- 1220/1671
- 1003/1671
-
3.3 Conditional Probability and Independent Events
Learning Objectives
- To learn the concept of a conditional probability and how to compute it.
- To learn the concept of independence of events, and how to apply it.
Conditional Probability
Suppose a fair die has been rolled and you are asked to give the probability that it was a five. There are six equally likely outcomes, so your answer is 1/6. But suppose that before you give your answer you are given the extra information that the number rolled was odd. Since there are only three odd numbers that are possible, one of which is five, you would certainly revise your estimate of the likelihood that a five was rolled from 1/6 to 1/3. In general, the revised probability that an event A has occurred, taking into account the additional information that another event B has definitely occurred on this trial of the experiment, is called the conditional probability of A given B and is denoted by The reasoning employed in this example can be generalized to yield the computational formula in the following definition.
Definition
The conditional probabilityThe probability of the event A taking into account the fact that event B is known to have occurred. of A given B, denoted , is the probability that event A has occurred in a trial of a random experiment for which it is known that event B has definitely occurred. It may be computed by means of the following formula:
Rule for Conditional Probability
Example 20
A fair die is rolled.
- Find the probability that the number rolled is a five, given that it is odd.
- Find the probability that the number rolled is odd, given that it is a five.
Solution:
The sample space for this experiment is the set consisting of six equally likely outcomes. Let F denote the event “a five is rolled” and let O denote the event “an odd number is rolled,” so that
-
This is the introductory example, so we already know that the answer is 1/3. To use the formula in the definition to confirm this we must replace A in the formula (the event whose likelihood we seek to estimate) by F and replace B (the event we know for certain has occurred) by O:
Since ,
Since ,
Thus
-
This is the same problem, but with the roles of F and O reversed. Since we are given that the number that was rolled is five, which is odd, the probability in question must be 1. To apply the formula to this case we must now replace A (the event whose likelihood we seek to estimate) by O and B (the event we know for certain has occurred) by F:
Obviously In part (a) we found that Thus
Just as we did not need the computational formula in this example, we do not need it when the information is presented in a two-way classification table, as in the next example.
Example 21
In a sample of 902 individuals under 40 who were or had previously been married, each person was classified according to gender and age at first marriage. The results are summarized in the following two-way classification table, where the meaning of the labels is:
- M: male
- F: female
- E: a teenager when first married
- W: in one’s twenties when first married
- H: in one’s thirties when first married
| E | W | H | Total | |
|---|---|---|---|---|
| M | 43 | 293 | 114 | 450 |
| F | 82 | 299 | 71 | 452 |
| Total | 125 | 592 | 185 | 902 |
The numbers in the first row mean that 43 people in the sample were men who were first married in their teens, 293 were men who were first married in their twenties, 114 men who were first married in their thirties, and a total of 450 people in the sample were men. Similarly for the numbers in the second row. The numbers in the last row mean that, irrespective of gender, 125 people in the sample were married in their teens, 592 in their twenties, 185 in their thirties, and that there were 902 people in the sample in all. Suppose that the proportions in the sample accurately reflect those in the population of all individuals in the population who are under 40 and who are or have previously been married. Suppose such a person is selected at random.
- Find the probability that the individual selected was a teenager at first marriage.
- Find the probability that the individual selected was a teenager at first marriage, given that the person is male.
Solution:
It is natural to let E also denote the event that the person selected was a teenager at first marriage and to let M denote the event that the person selected is male.
- According to the table the proportion of individuals in the sample who were in their teens at their first marriage is 125/902. This is the relative frequency of such people in the population, hence or about 14%.
-
Since it is known that the person selected is male, all the females may be removed from consideration, so that only the row in the table corresponding to men in the sample applies:
E W H Total M 43 293 114 450
The proportion of males in the sample who were in their teens at their first marriage is 43/450. This is the relative frequency of such people in the population of males, hence or about 10%.
In the next example, the computational formula in the definition must be used.
Example 22
Suppose that in an adult population the proportion of people who are both overweight and suffer hypertension is 0.09; the proportion of people who are not overweight but suffer hypertension is 0.11; the proportion of people who are overweight but do not suffer hypertension is 0.02; and the proportion of people who are neither overweight nor suffer hypertension is 0.78. An adult is randomly selected from this population.
- Find the probability that the person selected suffers hypertension given that he is overweight.
- Find the probability that the selected person suffers hypertension given that he is not overweight.
- Compare the two probabilities just found to give an answer to the question as to whether overweight people tend to suffer from hypertension.
Solution:
Let H denote the event “the person selected suffers hypertension.” Let O denote the event “the person selected is overweight.” The probability information given in the problem may be organized into the following contingency table:
| O | Oc | |
|---|---|---|
| H | 0.09 | 0.11 |
| Hc | 0.02 | 0.78 |
-
Using the formula in the definition of conditional probability,
-
Using the formula in the definition of conditional probability,
- is over six times as large as , which indicates a much higher rate of hypertension among people who are overweight than among people who are not overweight. It might be interesting to note that a direct comparison of and does not answer the same question.
Independent Events
Although typically we expect the conditional probability to be different from the probability of A, it does not have to be different from When , the occurrence of B has no effect on the likelihood of A. Whether or not the event A has occurred is independent of the event B.
Using algebra it can be shown that the equality holds if and only if the equality holds, which in turn is true if and only if This is the basis for the following definition.
Definition
Events A and B are independentEvents whose probability of occurring together is the product of their individual probabilities. if
If A and B are not independent then they are dependent.
The formula in the definition has two practical but exactly opposite uses:
-
In a situation in which we can compute all three probabilities , , and , it is used to check whether or not the events A and B are independent:
- If , then A and B are independent.
- If , then A and B are not independent.
- In a situation in which each of and can be computed and it is known that A and B are independent, then we can compute by multiplying together and :
Example 23
A single fair die is rolled. Let and Are A and B independent?
Solution:
In this example we can compute all three probabilities , , and Since the product is not the same number as , the events A and B are not independent.
Example 24
The two-way classification of married or previously married adults under 40 according to gender and age at first marriage in Note 3.48 "Example 21" produced the table
| E | W | H | Total | |
|---|---|---|---|---|
| M | 43 | 293 | 114 | 450 |
| F | 82 | 299 | 71 | 452 |
| Total | 125 | 592 | 185 | 902 |
Determine whether or not the events F: “female” and E: “was a teenager at first marriage” are independent.
Solution:
The table shows that in the sample of 902 such adults, 452 were female, 125 were teenagers at their first marriage, and 82 were females who were teenagers at their first marriage, so that
Since
is not the same as
we conclude that the two events are not independent.
Example 25
Many diagnostic tests for detecting diseases do not test for the disease directly but for a chemical or biological product of the disease, hence are not perfectly reliable. The sensitivity of a test is the probability that the test will be positive when administered to a person who has the disease. The higher the sensitivity, the greater the detection rate and the lower the false negative rate.
Suppose the sensitivity of a diagnostic procedure to test whether a person has a particular disease is 92%. A person who actually has the disease is tested for it using this procedure by two independent laboratories.
- What is the probability that both test results will be positive?
- What is the probability that at least one of the two test results will be positive?
Solution:
-
Let A1 denote the event “the test by the first laboratory is positive” and let A2 denote the event “the test by the second laboratory is positive.” Since A1 and A2 are independent,
-
Using the Additive Rule for Probability and the probability just computed,
Example 26
The specificity of a diagnostic test for a disease is the probability that the test will be negative when administered to a person who does not have the disease. The higher the specificity, the lower the false positive rate.
Suppose the specificity of a diagnostic procedure to test whether a person has a particular disease is 89%.
- A person who does not have the disease is tested for it using this procedure. What is the probability that the test result will be positive?
- A person who does not have the disease is tested for it by two independent laboratories using this procedure. What is the probability that both test results will be positive?
Solution:
-
Let B denote the event “the test result is positive.” The complement of B is that the test result is negative, and has probability the specificity of the test, 0.89. Thus
-
Let B1 denote the event “the test by the first laboratory is positive” and let B2 denote the event “the test by the second laboratory is positive.” Since B1 and B2 are independent, by part (a) of the example
The concept of independence applies to any number of events. For example, three events A, B, and C are independent if Note carefully that, as is the case with just two events, this is not a formula that is always valid, but holds precisely when the events in question are independent.
Example 27
The reliability of a system can be enhanced by redundancy, which means building two or more independent devices to do the same job, such as two independent braking systems in an automobile.
Suppose a particular species of trained dogs has a 90% chance of detecting contraband in airline luggage. If the luggage is checked three times by three different dogs independently of one another, what is the probability that contraband will be detected?
Solution:
Let D1 denote the event that the contraband is detected by the first dog, D2 the event that it is detected by the second dog, and D3 the event that it is detected by the third. Since each dog has a 90% of detecting the contraband, by the Probability Rule for Complements it has a 10% chance of failing. In symbols, , and
Let D denote the event that the contraband is detected. We seek It is easier to find , because although there are several ways for the contraband to be detected, there is only one way for it to go undetected: all three dogs must fail. Thus , and
But the events D1, D2, and D3 are independent, which implies that their complements are independent, so
Using this number in the previous display we obtain
That is, although any one dog has only a 90% chance of detecting the contraband, three dogs working independently have a 99.9% chance of detecting it.
Probabilities on Tree Diagrams
Some probability problems are made much simpler when approached using a tree diagram. The next example illustrates how to place probabilities on a tree diagram and use it to solve a problem.
Example 28
A jar contains 10 marbles, 7 black and 3 white. Two marbles are drawn without replacement, which means that the first one is not put back before the second one is drawn.
- What is the probability that both marbles are black?
- What is the probability that exactly one marble is black?
- What is the probability that at least one marble is black?
Solution:
A tree diagram for the situation of drawing one marble after the other without replacement is shown in Figure 3.6 "Tree Diagram for Drawing Two Marbles". The circle and rectangle will be explained later, and should be ignored for now.
Figure 3.6 Tree Diagram for Drawing Two Marbles
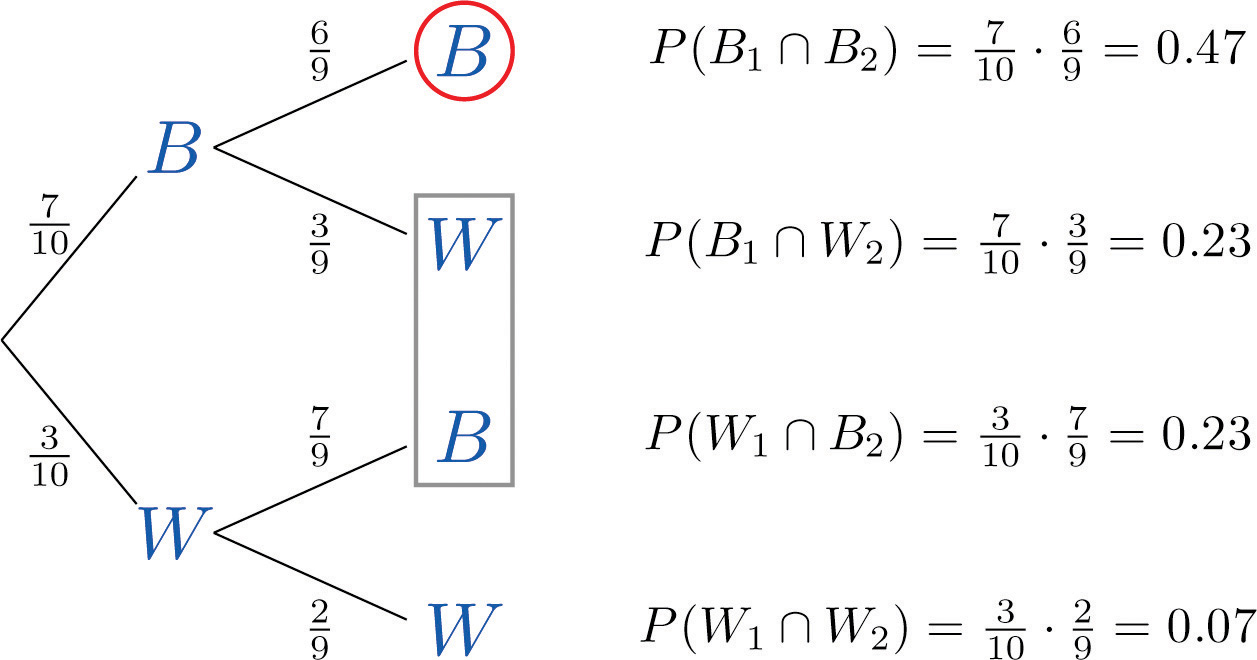
The numbers on the two leftmost branches are the probabilities of getting either a black marble, 7 out of 10, or a white marble, 3 out of 10, on the first draw. The number on each remaining branch is the probability of the event corresponding to the node on the right end of the branch occurring, given that the event corresponding to the node on the left end of the branch has occurred. Thus for the top branch, connecting the two Bs, it is , where B1 denotes the event “the first marble drawn is black” and B2 denotes the event “the second marble drawn is black.” Since after drawing a black marble out there are 9 marbles left, of which 6 are black, this probability is 6/9.
The number to the right of each final node is computed as shown, using the principle that if the formula in the Conditional Rule for Probability is multiplied by , then the result is
- The event “both marbles are black” is and corresponds to the top right node in the tree, which has been circled. Thus as indicated there, it is 0.47.
- The event “exactly one marble is black” corresponds to the two nodes of the tree enclosed by the rectangle. The events that correspond to these two nodes are mutually exclusive: black followed by white is incompatible with white followed by black. Thus in accordance with the Additive Rule for Probability we merely add the two probabilities next to these nodes, since what would be subtracted from the sum is zero. Thus the probability of drawing exactly one black marble in two tries is
-
The event “at least one marble is black” corresponds to the three nodes of the tree enclosed by either the circle or the rectangle. The events that correspond to these nodes are mutually exclusive, so as in part (b) we merely add the probabilities next to these nodes. Thus the probability of drawing at least one black marble in two tries is
Of course, this answer could have been found more easily using the Probability Law for Complements, simply subtracting the probability of the complementary event, “two white marbles are drawn,” from 1 to obtain
As this example shows, finding the probability for each branch is fairly straightforward, since we compute it knowing everything that has happened in the sequence of steps so far. Two principles that are true in general emerge from this example:
Probabilities on Tree Diagrams
- The probability of the event corresponding to any node on a tree is the product of the numbers on the unique path of branches that leads to that node from the start.
- If an event corresponds to several final nodes, then its probability is obtained by adding the numbers next to those nodes.
Key Takeaways
- A conditional probability is the probability that an event has occurred, taking into account additional information about the result of the experiment.
- A conditional probability can always be computed using the formula in the definition. Sometimes it can be computed by discarding part of the sample space.
- Two events A and B are independent if the probability of their intersection A ∩ B is equal to the product of their individual probabilities.
Exercises
-
For two events A and B, , , and
- Find
- Find
- Determine whether or not A and B are independent.
-
For two events A and B, , , and
- Find
- Find
- Determine whether or not A and B are independent.
-
For independent events A and B, and
- Find
- Find
- Find
-
For independent events A and B, and
- Find
- Find
- Find
-
For mutually exclusive events A and B, and
- Find
- Find
-
For mutually exclusive events A and B, and
- Find
- Find
-
Compute the following probabilities in connection with the roll of a single fair die.
- The probability that the roll is even.
- The probability that the roll is even, given that it is not a two.
- The probability that the roll is even, given that it is not a one.
-
Compute the following probabilities in connection with two tosses of a fair coin.
- The probability that the second toss is heads.
- The probability that the second toss is heads, given that the first toss is heads.
- The probability that the second toss is heads, given that at least one of the two tosses is heads.
-
A special deck of 16 cards has 4 that are blue, 4 yellow, 4 green, and 4 red. The four cards of each color are numbered from one to four. A single card is drawn at random. Find the following probabilities.
- The probability that the card drawn is red.
- The probability that the card is red, given that it is not green.
- The probability that the card is red, given that it is neither red nor yellow.
- The probability that the card is red, given that it is not a four.
-
A special deck of 16 cards has 4 that are blue, 4 yellow, 4 green, and 4 red. The four cards of each color are numbered from one to four. A single card is drawn at random. Find the following probabilities.
- The probability that the card drawn is a two or a four.
- The probability that the card is a two or a four, given that it is not a one.
- The probability that the card is a two or a four, given that it is either a two or a three.
- The probability that the card is a two or a four, given that it is red or green.
-
A random experiment gave rise to the two-way contingency table shown. Use it to compute the probabilities indicated.
R S A 0.12 0.18 B 0.28 0.42 - , ,
- Based on the answer to (a), determine whether or not the events A and R are independent.
- Based on the answer to (b), determine whether or not can be predicted without any computation. If so, make the prediction. In any case, compute using the Rule for Conditional Probability.
-
A random experiment gave rise to the two-way contingency table shown. Use it to compute the probabilities indicated.
R S A 0.13 0.07 B 0.61 0.19 - , ,
- Based on the answer to (a), determine whether or not the events A and R are independent.
- Based on the answer to (b), determine whether or not can be predicted without any computation. If so, make the prediction. In any case, compute using the Rule for Conditional Probability.
-
Suppose for events A and B in a random experiment and Compute the indicated probability, or explain why there is not enough information to do so.
- , with the extra information that A and B are independent.
- , with the extra information that A and B are mutually exclusive.
-
Suppose for events A and B connected to some random experiment, and Compute the indicated probability, or explain why there is not enough information to do so.
- , with the extra information that A and B are independent.
- , with the extra information that A and B are mutually exclusive.
-
Suppose for events A, B, and C connected to some random experiment, A, B, and C are independent and , , and Compute the indicated probability, or explain why there is not enough information to do so.
-
Suppose for events A, B, and C connected to some random experiment, A, B, and C are independent and , , and Compute the indicated probability, or explain why there is not enough information to do so.
Basic
-
The sample space that describes all three-child families according to the genders of the children with respect to birth order is
In the experiment of selecting a three-child family at random, compute each of the following probabilities, assuming all outcomes are equally likely.
- The probability that the family has at least two boys.
- The probability that the family has at least two boys, given that not all of the children are girls.
- The probability that at least one child is a boy.
- The probability that at least one child is a boy, given that the first born is a girl.
-
The following two-way contingency table gives the breakdown of the population in a particular locale according to age and number of vehicular moving violations in the past three years:
Age Violations 0 1 2+ Under 21 0.04 0.06 0.02 21–40 0.25 0.16 0.01 41–60 0.23 0.10 0.02 60+ 0.08 0.03 0.00 A person is selected at random. Find the following probabilities.
- The person is under 21.
- The person has had at least two violations in the past three years.
- The person has had at least two violations in the past three years, given that he is under 21.
- The person is under 21, given that he has had at least two violations in the past three years.
- Determine whether the events “the person is under 21” and “the person has had at least two violations in the past three years” are independent or not.
-
The following two-way contingency table gives the breakdown of the population in a particular locale according to party affiliation (A, B, C, or None) and opinion on a bond issue:
Affiliation Opinion Favors Opposes Undecided A 0.12 0.09 0.07 B 0.16 0.12 0.14 C 0.04 0.03 0.06 None 0.08 0.06 0.03 A person is selected at random. Find each of the following probabilities.
- The person is in favor of the bond issue.
- The person is in favor of the bond issue, given that he is affiliated with party A.
- The person is in favor of the bond issue, given that he is affiliated with party B.
-
The following two-way contingency table gives the breakdown of the population of patrons at a grocery store according to the number of items purchased and whether or not the patron made an impulse purchase at the checkout counter:
Number of Items Impulse Purchase Made Not Made Few 0.01 0.19 Many 0.04 0.76 A patron is selected at random. Find each of the following probabilities.
- The patron made an impulse purchase.
- The patron made an impulse purchase, given that the total number of items purchased was many.
- Determine whether or not the events “few purchases” and “made an impulse purchase at the checkout counter” are independent.
-
The following two-way contingency table gives the breakdown of the population of adults in a particular locale according to employment type and level of life insurance:
Employment Type Level of Insurance Low Medium High Unskilled 0.07 0.19 0.00 Semi-skilled 0.04 0.28 0.08 Skilled 0.03 0.18 0.05 Professional 0.01 0.05 0.02 An adult is selected at random. Find each of the following probabilities.
- The person has a high level of life insurance.
- The person has a high level of life insurance, given that he does not have a professional position.
- The person has a high level of life insurance, given that he has a professional position.
- Determine whether or not the events “has a high level of life insurance” and “has a professional position” are independent.
-
The sample space of equally likely outcomes for the experiment of rolling two fair dice is
Identify the events N: the sum is at least nine, T: at least one of the dice is a two, and F: at least one of the dice is a five.
- Find
- Find
- Find
- Determine from the previous answers whether or not the events N and F are independent; whether or not N and T are.
-
The sensitivity of a drug test is the probability that the test will be positive when administered to a person who has actually taken the drug. Suppose that there are two independent tests to detect the presence of a certain type of banned drugs in athletes. One has sensitivity 0.75; the other has sensitivity 0.85. If both are applied to an athlete who has taken this type of drug, what is the chance that his usage will go undetected?
-
A man has two lights in his well house to keep the pipes from freezing in winter. He checks the lights daily. Each light has probability 0.002 of burning out before it is checked the next day (independently of the other light).
- If the lights are wired in parallel one will continue to shine even if the other burns out. In this situation, compute the probability that at least one light will continue to shine for the full 24 hours. Note the greatly increased reliability of the system of two bulbs over that of a single bulb.
- If the lights are wired in series neither one will continue to shine even if only one of them burns out. In this situation, compute the probability that at least one light will continue to shine for the full 24 hours. Note the slightly decreased reliability of the system of two bulbs over that of a single bulb.
-
An accountant has observed that 5% of all copies of a particular two-part form have an error in Part I, and 2% have an error in Part II. If the errors occur independently, find the probability that a randomly selected form will be error-free.
-
A box contains 20 screws which are identical in size, but 12 of which are zinc coated and 8 of which are not. Two screws are selected at random, without replacement.
- Find the probability that both are zinc coated.
- Find the probability that at least one is zinc coated.
Applications
-
Events A and B are mutually exclusive. Find
-
The city council of a particular city is composed of five members of party A, four members of party B, and three independents. Two council members are randomly selected to form an investigative committee.
- Find the probability that both are from party A.
- Find the probability that at least one is an independent.
- Find the probability that the two have different party affiliations (that is, not both A, not both B, and not both independent).
-
A basketball player makes 60% of the free throws that he attempts, except that if he has just tried and missed a free throw then his chances of making a second one go down to only 30%. Suppose he has just been awarded two free throws.
- Find the probability that he makes both.
- Find the probability that he makes at least one. (A tree diagram could help.)
-
An economist wishes to ascertain the proportion p of the population of individual taxpayers who have purposely submitted fraudulent information on an income tax return. To truly guarantee anonymity of the taxpayers in a random survey, taxpayers questioned are given the following instructions.
- Flip a coin.
- If the coin lands heads, answer “Yes” to the question “Have you ever submitted fraudulent information on a tax return?” even if you have not.
- If the coin lands tails, give a truthful “Yes” or “No” answer to the question “Have you ever submitted fraudulent information on a tax return?”
The questioner is not told how the coin landed, so he does not know if a “Yes” answer is the truth or is given only because of the coin toss.
-
Using the Probability Rule for Complements and the independence of the coin toss and the taxpayers’ status fill in the empty cells in the two-way contingency table shown. Assume that the coin is fair. Each cell except the two in the bottom row will contain the unknown proportion (or probability) p.
Status Coin Probability H T Fraud p No fraud Probability 1 -
The only information that the economist sees are the entries in the following table:
Equate the entry in the one cell in the table in (a) that corresponds to the answer “No” to the number s to obtain the formula that expresses the unknown number p in terms of the known number s.
- Equate the sum of the entries in the three cells in the table in (a) that together correspond to the answer “Yes” to the number r to obtain the formula that expresses the unknown number p in terms of the known number r.
- Use the fact that (since they are the probabilities of complementary events) to verify that the formulas in (b) and (c) give the same value for p. (For example, insert into the formula in (b) to obtain the formula in (c).)
- Suppose a survey of 1,200 taxpayers is conducted and 690 respond “Yes” (truthfully or not) to the question “Have you ever submitted fraudulent information on a tax return?” Use the answer to either (b) or (c) to estimate the true proportion p of all individual taxpayers who have purposely submitted fraudulent information on an income tax return.
Additional Exercises
Answers
-
- 0.6
- 0.4
- not independent
-
-
- 0.22
- 0.81
- 0.27
-
-
- 0
- 0
-
-
- 0.5
- 0.4
- 0.6
-
-
- 0.25
- 0.33
- 0
- 0.25
-
-
- , ,
- independent
- without computation 0.3
-
-
- Insufficient information. The events A and B are not known to be either independent or mutually exclusive.
- 0.21
- 0
-
-
- 0.25
- 0.02
-
-
- 0.5
- 0.57
- 0.875
- 0.75
-
-
- 0.4
- 0.43
- 0.38
-
-
- 0.15
- 0.14
- 0.25
- not independent
-
-
0.0375
-
-
0.931
-
-
0
-
-
- 0.36
- 0.72
-